Current Issue
Blood Level of Alpha-1 Antitrypsin in the Course of Acute Myocardial Infarction
Bayan Abu al-rub1,*, Said Y Khatib1, Nosayba Z Alazzam1, Sana’a A Jaber2, Issam SM Mokhadder3, Anas Alshannag3, Osama Dweekat3
1Department of Physiology, Faculty of Medicine, Jordan University of Science and Technology, Irbid, Jordan
2Department of Clinical Pharmacy, Faculty of Pharmacy, Jordan University of Science and Technology, Irbid, Jordan
3Medical Student, Jordan University of Science and Technology, Irbid, Jordan
*Corresponding author: Bayan Abu al-rub, Department of Physiology, Faculty of Medicine, Jordan University of Science and Technology, Irbid, Jordan, Tel: 00962780557521, E-mail: [email protected]
Received Date: August 08, 2024
Publication Date: November 09, 2024
Citation: Abu al-rub B, et al. (2024). Blood Level of Alpha-1 Antitrypsin in the Course of Acute Myocardial Infarction. Cardiac. 4(1):9.
Copyright: Abu al-rub B, et al. © (2024).
ABSTRACT
Even though cardiovascular disease is the leading cause of death in the Middle East, studies that evaluated the effect of acute phase reactants such as Alpha-1 Antitrypsin (A1AT) in the course of myocardial infarction (MI) are not enough. The current study aimed to examine the level of A1AT during the first 48 hours after MI. Additionally, to assess if its concentration is affected by some co-morbidities, namely, smoking, hypertension, and diabetes. Blood samples were collected from MI patients at specific time points after admission. Control blood samples were collected from 20 healthy individuals. A1AT was determined in plasma using Enzyme-Linked Immunosorbent Assay (ELISA) kits. All values are expressed as mean and Standard Error of the Mean (mean ± SEM) by unit g/L. There was a significant difference in A1AT concentration between the control group (1.012 g/L ± 0.155 g/L) and the 6-hour sample (1.505 g/L ± 0.11 g/L), (P value of 0.046). There was a significant difference in A1AT concentration in the first sample, between hypertensive MI patients (1.126 g/L ± 0.155 g/L) and non-hypertensive MI patients (1.740 g/L ± 0.124 g/L) P<0.05. There was a difference between smokers (1.321 g/L, 1.310 g/L) and non-smokers (1.726 g/L, 1.438 g/L) in 12-hour and 24-hour samples respectively, but this difference doesn’t reach a significant level. We concluded that A1AT concentration increases during acute MI, as it is one of the acute phase reactants. Moreover, A1AT levels differ between patients with different comorbidities. Our findings suggest that A1AT response during acute MI is affected by the presence or absence of smoking or hypertension (HTN).
NEW & NOTEWORTHY
A1AT concentration significantly increased during the first hours after acute Myocardial Infarction (MI) compared to the control group. During the first 6 hours after MI, A1AT concentration was significantly higher in non-hypertensives than hypertensives. Regarding the ratio of A1AT concentration in our MI patients to the control group, it is higher in non-smokers compared to smokers during the whole period of our study and higher in non-hypertensives compared to hypertensives during the first 12 hours of our study.
Keywords: Alpha-1 Antitrypsin, Cardiovascular Disease, Acute Myocardial Infarction, Smoking, Hypertension, Diabetes
INTRODUCTION
Background
Cardiovascular disease (CVD) is the most common cause of mortality and a crucial contributor to serious illnesses in people of different ages around the world [1]. CVD is a class of diseases that involve the heart or blood vessels [2]. CVDs constitute the leading cause of global mortality and are a major contributor to reduced quality of life [3,4]. The main function of the human heart is to provide oxygenated blood to different body organs. To do so, the heart itself needs to be oxygenated. The heart is supplied with blood via a special network of blood vessels called coronary arteries. If these coronary arteries suffer from any injury or narrowing, the heart will not get enough blood, leading to myocyte hypoxia and ischemia. Ischemic Heart Disease (IHD) or Acute Coronary Syndrome (ACS) often reflects a degree of injury to these coronary arteries by atherosclerosis, plaque rupture, thrombosis, inflammation, and vasoconstriction [5].
IHD Symptoms
Symptoms suggestive of cardiac ischemia include retrosternal chest pain (with or without radiation to either arm, the neck, or the jaw), oppressive chest pressure, abdominal pain, dyspnea, nausea, vomiting, diaphoresis, and syncope [6].
ACS Co-Morbidities and Risk Factors
The risk factors for coronary artery disease (CAD) include hypercholesterolemia, hypertension, diabetes mellitus (DM), smoking, obesity, lack of physical activity, unhealthy diet, and stress [7].
Inflammation Role during MI
After acute MI, an initial pro-inflammatory response is initiated to remove necrotic cell remnants from the area of MI. The initial pro-inflammatory response is then accompanied by an anti-inflammatory reparative stage which allows wound healing and scar formation to occur thereby preventing cardiac rupture. The transition between these two stages is coordinated by a finely regulated, but complex interaction, between multiple players within the heart itself (including cardiomyocytes, endothelial cells, fibroblasts, and the interstitium), and components of the immune response (including neutrophils, monocytes, macrophages, dendritic cells, and lymphocytes) [8].
Alpha-1 Antitrypsin (A1AT)
Human A1AT is a water-soluble circulating glycoprotein, with a molecular weight of 52 kDa and a blood half-life of 4–5 days. Over 80% of A1AT is synthesized and secreted by hepatocytes, and in additional quantities by monocytes, macrophages, pancreas, lung alveolar cells, enterocytes, and endothelium. The major function of A1AT is to inhibit neutrophil elastase. Humans produce 34 mg per kg every day, resulting in high plasma concentrations of 1–2 g/L. During acute-phase responses, A1AT levels increase up to fourfold [9].
A1AT in Acute MI
In MI, the blood supply to certain areas stops. These areas are normally supplied via the blocked coronary artery. It is found that even after reperfusion, the area of MI continues to enlarge for hours. We can rescue the injured but viable myocardium if we can stop signals leading to cell death. Shortly after ischemia-reperfusion, the caspase-1 inflammasome in the heart is activated, and this is a major contributor to the final infarct size. It is proven that plasma-derived A1AT plays an important role in the inhibition of inflammasome formation in vitro and in vivo as well [10]. Administration of plasma-derived A1AT quenches the inflammatory response in experimental MI in the mouse and reduces the amount of injury because of ischemia-reperfusion [11].
In a study conducted on patients with STEMI, 60 mg/kg of Prolastin C (plasma-derived A1AT) was given to patients intravenously within 12 hours of reperfusion. When compared with historical placebo-treated controls, patients with STEMI treated with Prolastin C administered after reperfusion experienced less ischemia-reperfusion injury because of a reduction in the inflammatory response [12]. In another study, it was reported that the plasma levels of A1AT were significantly less during MI attack in smokers compared to non-smokers, also patients in whom the level of A1AT dropped to more than 50% of normal values didn’t survive the myocardial attack [13]. Lubrano et al., 2020 found that A1AT overproduction is a protective mechanism induced by increased levels of proteases and perhaps by the loss of antiprotease activity caused by high oxidative stress observed in heart failure patients [14].
Lind et al., 2004 reported that inflammation-sensitive proteins (ISP) including A1AT levels are related to carboxyhemoglobin (COHb%) in smokers. Moreover, high levels are associated with an increased cardiovascular risk [15]. So, it is expected that smokers have elevated A1AT plasma concentrations compared to non-smokers.
MATERIALS AND METHODS
The study included MI patients admitted to King Abdullah University Hospital and Princess Basma Hospital from July 2021–April 2022. Patients were admitted to the intensive cardiac care unit within 24 hours of the onset of symptoms, and their stays lasted between two to four days. The diagnosis of acute MI was made when at least two of the following three criteria were present: (1) typical symptoms, (2) ST segment elevation on the electrocardiograph, and (3) increased levels of the serum enzymes creatine kinase (CK), cardiac troponin T and troponin I.
Blood samples were collected from MI patients (n = 34, aged 22-77 yrs., 31 males, and 3 females) at specific time intervals after confirmed diagnosis and admission. The patients were classified into diabetic (n = 9, 8 males, and 1 female) or non-diabetic (n = 25, 23 males, and 2 females), hypertensive (n = 13, 12 males, and 1 female) or non-hypertensive (n = 21, 19 males, and 2 females), and finally smoker (n = 28, 27 males, and 1 female) or non-smoker (n = 6, 4 males, and 2 females). Control blood samples were collected from 20 healthy individuals (18 males and 2 females). All participants signed the Institutional Review Board (IRB) approval and consent forms. A peripheral venous blood sample was obtained from patients. The first sample was drawn within 6 hours of admission to the intensive cardiac care unit, then a second sample was obtained after 12 hours of admission, and more samples at 24, and 48 hours. All patients had three or more consecutive examinations. Blood samples were collected in tubes containing Ethylenediaminetetraacetic acid (EDTA) to prevent blood coagulation and were centrifuged at 4000 rpm at 4°C for 10 min. Plasma was separated and stored at -80°C until it was analyzed. A1AT was determined in plasma using ELISA kits (Abcam, USA).
Descriptive statistics and normality tests were conducted. The trend of A1AT concentration and the difference between A1AT concentration in the control group and the participating MI patients were examined using the One-way ANOVA test. The difference between A1AT concentration in study subgroups (smokers vs non-smokers, diabetics vs non-diabetics, hypertensives vs non-hypertensives) was examined using a two-tailed unpaired t-test. All analyses were performed using GraphPad Prism Version 9.4.1 (458).
RESULTS
A1AT Concentration in the Control Group
A1AT concentration has been measured in the plasma of 20 participants considered as a control group. Individuals in the control group had no history of IHD. Among those 20 individuals (18 males and 2 females), 9 were smokers (all were males) and 11 were non-smokers (9 males, and 2 females). Three were hypertensives (all were males) and 17 were non-hypertensives (15 males, and 2 females). All individuals in the control group were non-diabetics. A1AT concentration as well as the clinical characteristics of participants in the control group are shown in Table 1.
Table 1. Number of participants in subgroups of the control group and A1AT concentration mean in each subgroup ± SEM
|
Participants in the control group |
Smokers in the control group |
Non-smokers in the control group |
Diabetics in the control group |
Non-diabetics in the control group |
Hypertensives in the control group |
Non-hypertensives in the control group |
|
|
Number |
20 |
9 |
11 |
0 |
20 |
3 |
17 |
|
A1AT concentration means (g/L) ± SEM |
1.01 ± 0.12 |
1.23 ± 0.2 |
0.83 ± 0.14 |
- |
1.01 ± 0.12 |
0.90 ± 044 |
1.03 ± 0.13 |
A1AT was measured in 34 MI patients within 48 hours of admission to the hospital. Each patient gave at least 3 samples over the first 48 hours following admission to the hospital. S1 represents the first sample which was taken within 6 hours of admission. S2 represents the second sample which was taken after 12 hours of admission. S3 represents the third sample which was taken after 24 hours of admission. Finally, S4 represents the fourth sample which was taken after 48 hours of admission. A1AT concentrations of participating MI patients are shown in Table 2.
A1AT concentrations of the participating MI patients over the time points of the study
Table 2. A1AT concentrations over the time points of the study (Mean ± SEM, n=34)
|
Time points |
6 hours (g/L) |
12 hours (g/L) |
24 hours (g/L) |
48 hours (g/L) |
|
Mean ± SEM |
1.51 ± 0.11 |
1.31 ± 0.11 |
1.30 ± 0.12 |
1.19 ± 0.14 |
Figure 1. A1AT concentration in MI patients over the time course of the study in comparison to the control group. * Indicates significant difference with the control group (P <0.05)
Figure 2. A1AT concentration was significantly elevated in the 6 hours sample (1.505 g/l ± 0.11 g/l) compared to the control group (1.012 g/l ± 0.155 g/l) All values are expressed as (g/l, and mean ± SEM).
There was a significant difference in A1AT concentration only between the control group (1.012 g/L ± 0.155 g/L) and the 6 hours sample (1.505 g/L ± 0.11 g/L), (P value of 0.0459) as illustrated in Figures 1 and 2.
A1AT Concentration in Smoker MI Patients in Comparison to Non-smokers
A1AT concentrations in Smoker MI Patients over the time course of the study are shown in Table 3, and A1AT concentrations in non-smoker MI Patients are shown in Table 4.
6 hours sample
Mean A1AT: (1.505 g/l)
12 hours sample
Mean A1AT: (1.311 g/l)
24 hours sample
Mean A1AT: (1.298 g/l)
48 hours sample
Mean A1AT: (1.188 g/l)
MI
Table 3. A1AT concentrations in smoking MI patients over the period of the study (Mean ± SEM)
|
|
A1AT con. in smoking MI patients at 6 hours (g/L) |
A1AT con. In smoking MI patients at 12 hours (g/L) |
A1AT con. In smoking MI patients at 24 hours (g/L) |
A1AT con. In smoking MI patients at 48 hours (g/L) |
|
Mean ± SEM |
1.55 ± 0.11 |
1.32 ± 0.15 |
1.31 ± 0.14 |
1.25 ± 0.19 |
6 hours sample
Mean A1AT: (1.505 g/l)
12 hours sample
Mean A1AT: (1.311 g/l)
24 hours sample
Mean A1AT: (1.298 g/l)
48 hours sample
Mean A1AT: (1.188 g/l)
MI
Table 4. A1AT concentrations in non-smoking MI patients over the period of the study (Mean ± SEM)
|
A1AT con. in non-smoking MI patients at 6 hours (g/L) |
A1AT con. in non-smoking MI patients at 12 hours (g/L) |
A1AT con. in non-smoking MI patients at 24 hours (g/L) |
A1AT con. in non-smoking MI patients at 48 hours (g/L) |
|
|
Mean ± SEM |
1.3 ± 0.37 |
1.24 ± 0.52 |
1.24 ± 0.29 |
0.98 ± 0.21 |
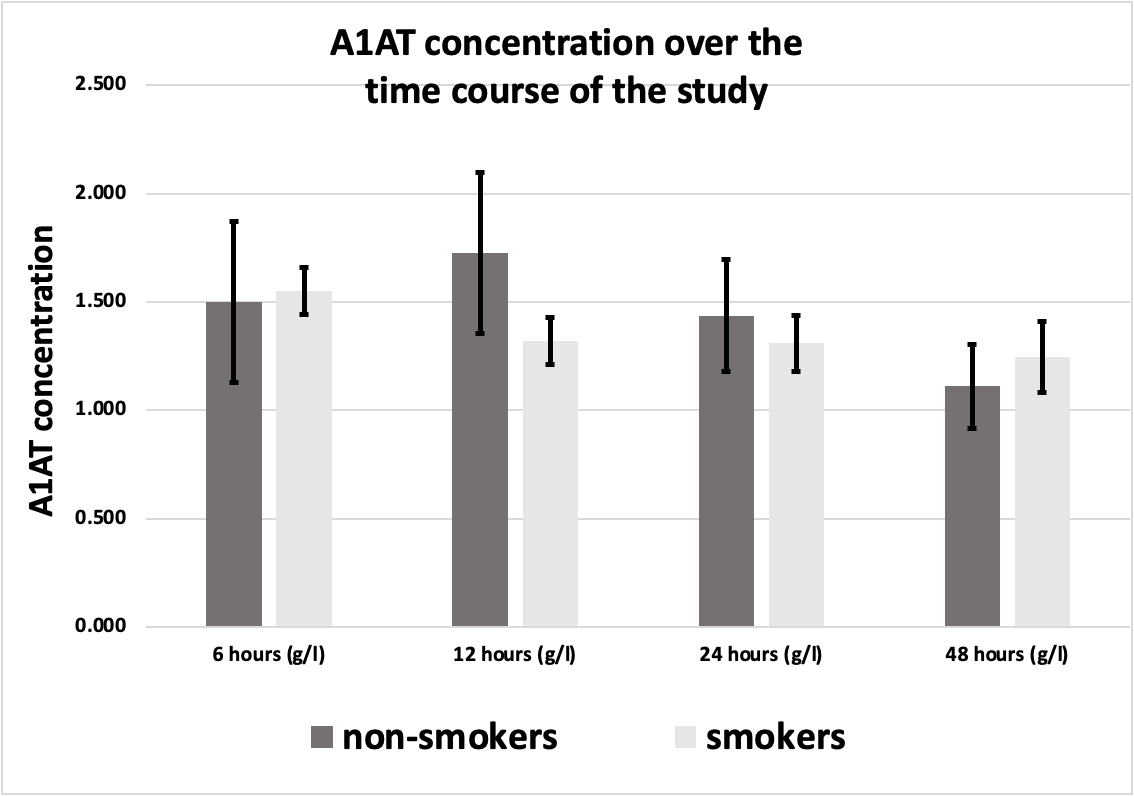
Figure 3. A1AT concentration in smoker MI patients (n=28) in comparison to non-smokers (n=6) over the time course of the study) All values are expressed as (g/L).
Out of 34 participating patients, 28 were smokers (27 males, and 1 female) while 6 were non-smokers (4 males, and 2 females). No significant difference between smokers and non-smokers was noted in A1AT concentrations during the MI course (Figure 3). There was a difference between smokers (1.321 g/L, 1.310 g/L) and non-smokers (1.726 g/L, 1.438 g/L) in 12-hour and 24-hour samples respectively, but this difference doesn’t reach a significant level.
A1AT Concentration in Hypertensive MI Patients in Comparison to Non-hypertensives
A1AT concentrations in Hypertensive MI Patients over the time course of the study are shown in Table 5, and A1AT concentrations in non-Hypertensive MI Patients are shown in Table 6.
Table 5. A1AT concentrations in hypertensive MI patients over the period of the study (Mean ± SEM)
|
A1AT con. in hypertensive MI patients at 6 hours (g/L) |
A1AT con. In hypertensive MI patients at 12 hours (g/L) |
A1AT con. In hypertensive MI patients at 24 hours (g/L) |
A1AT con. In hypertensive MI patients at 48 hours (g/L) |
|
|
Mean ± SEM |
1.13 ± 0.16 |
1.01 ± 0.23 |
1.34 ± 0.23 |
1.21 ± 0.2 |
Table 6. A1AT concentrations in non-hypertensive MI patients over the period of the study (Mean ± SEM)
|
A1AT con. in non-hypertensive MI patients at 6 hours (g/L) |
A1AT con. In non-hypertensive MI patients at 12 hours (g/L) |
A1AT con. In non-hypertensive MI patients at 24 hours (g/L) |
A1AT con. In non-hypertensive MI patients at 48 hours (g/L) |
|
|
Mean± SEM |
1.74 ± 0.12 |
1.51 ± 0.2 |
1.27 ± 0.14 |
1.17 ± 0.22 |
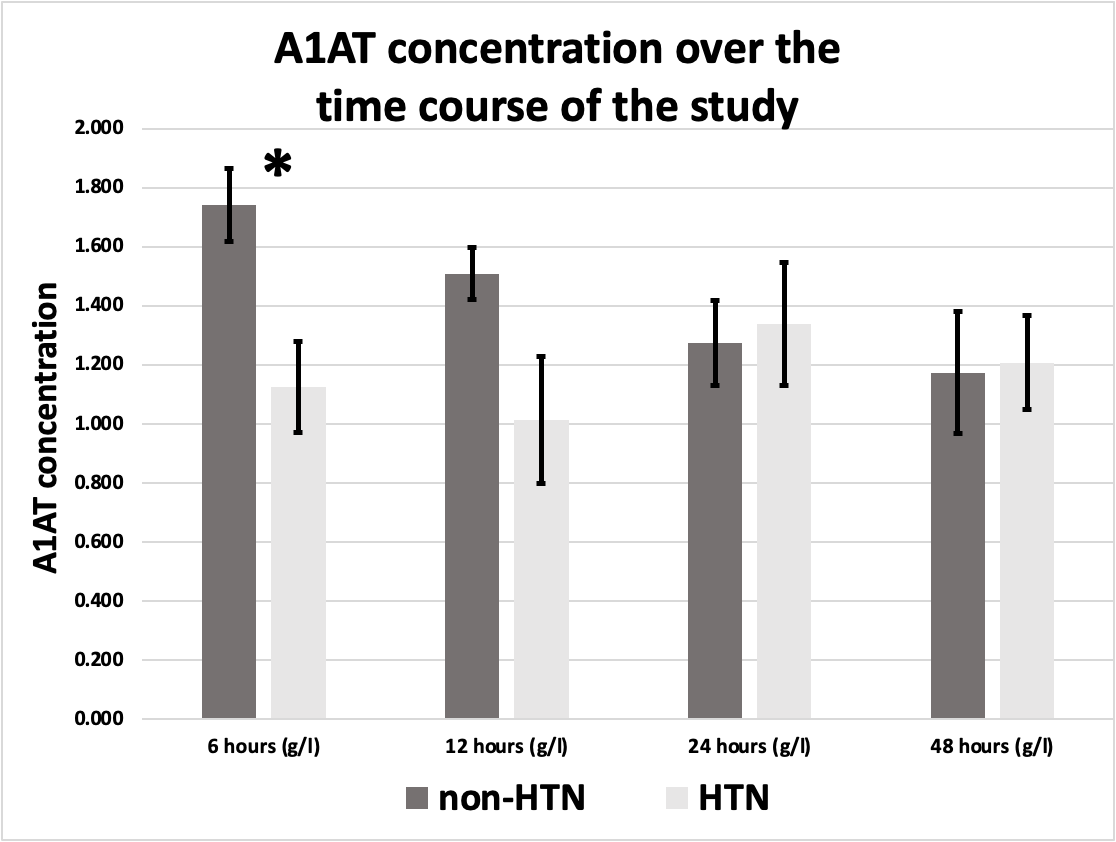
Figure 4. A1AT concentration in hypertensive MI patients (n=13) in comparison to non-hypertensive (n=21) over the time course of the study. *Indicates significant difference (P <0.05),) All values are expressed as (g/L).
Out of 34 patients, 13 were hypertensives (12 males, and 1 female), while 21 were non-hypertensives (19 males, and 2 females).
There was a significant difference in A1AT concentration in the first sample (6 hours sample) between hypertensive MI patients (1.126 g/L ± 0.155 g/L) and non-hypertensive MI patients (1.740 g/L ± 0.124 g/L) P<0.05. The results are represented in Figure 4.
No significant differences were found in A1AT concentrations in the second, third, or fourth samples (S2, S3, or S4) when comparing hypertensives with non-hypertensives.
When comparing control with MI patients, no significant differences were found in A1AT concentrations in any of the first, second, third, or fourth samples (S1, S2, S3, or S4).
A1AT Concentration in MI Patients Diabetics and Non-diabetics
A1AT concentrations in diabetic MI Patients over the time course of the study are shown in Table 7, and A1AT concentrations in non-diabetic MI Patients are shown in Table 8.
Table 7. A1AT concentrations in diabetic MI patients over the period of the study (Mean ± SEM)
|
A1AT con. in diabetic MI patients at 6 hours (g/L) |
A1AT con. In diabetic MI patients at 12 hours (g/L) |
A1AT con. In diabetic MI patients at 24 hours (g/L) |
A1AT con. In diabetic MI patients at 48 hours (g/L) |
|
|
Mean ± SEM |
1.26 ± 0.12 |
1.3 ± 0.29 |
1.24 ± 0.29 |
1.34 ± 0.24 |
Table 8. A1AT concentrations in non-diabetic MI patients over the period of the study (Mean ± SEM)
|
A1AT con. in non-diabetic MI patients at 6 hours (g/L) |
A1AT con. In non-diabetic MI patients at 12 hours (g/L) |
A1AT con. In non-diabetic MI patients at 24 hours (g/L) |
A1AT con. In non-diabetic MI patients at 48 hours (g/L) |
|
|
Mean ± SEM |
1.6 ± 0.14 |
1.32 ± 0.18 |
1.32 ± 0.13 |
1.13 ± 0.19 |
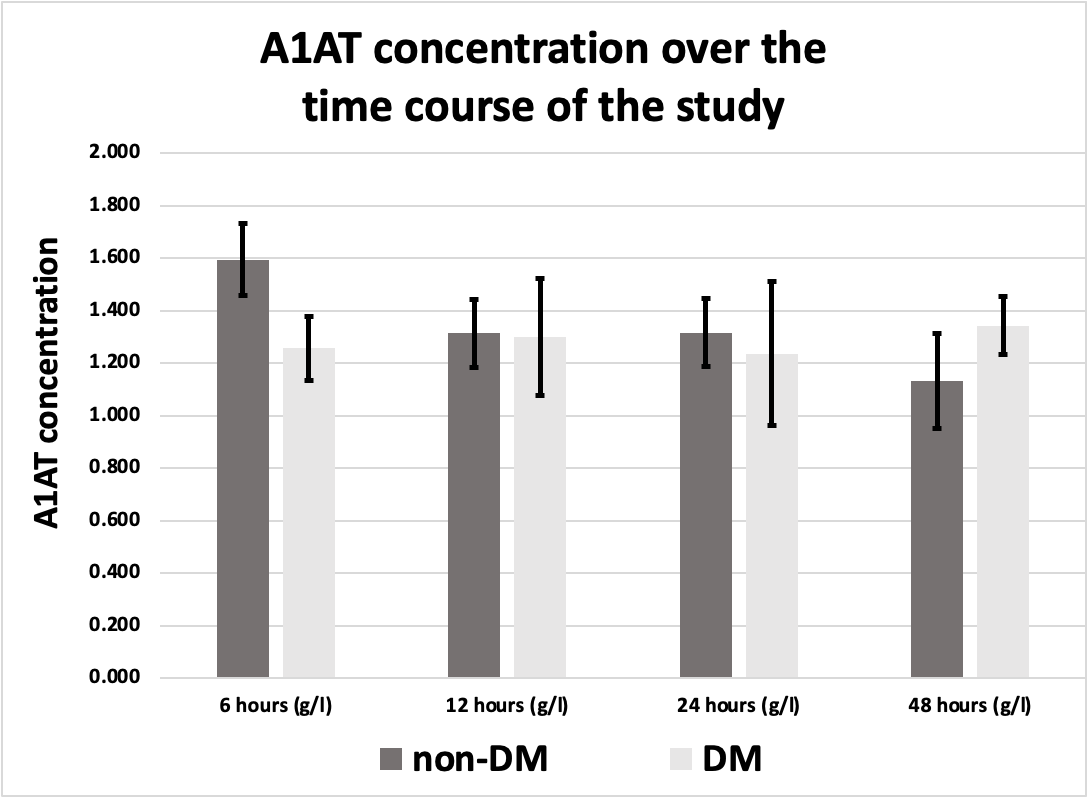
Figure 5. A1AT concentration in diabetic MI patients (n=9) in comparison to non-diabetic (n=25) over the time course of the study, all values are expressed as (g/L).
Out of 34 participating patients, 9 were diabetics (8 males, and 1 female), while 25 were non-diabetics (23 males, and 2 females). No significant difference was found in A1AT concentrations in any of the samples (S1, S2, S3, and S4) between diabetics and non-diabetics (Figure 5).
A1AT Concentration Ratio in MI Patients in Relation to the Control Group
We calculated the percentage of A1AT concentration in each subgroup in relation to its mean in the corresponding control subgroup, according to the following equation:
A1AT con. for each MI patient sample / A1AT con. mean of the control group X 100% ………………equation 1
We did this to know the change in A1AT during MI compared to the baseline, and to compare this change between subgroups of interest (smokers vs non-smokers, hypertensives vs non- hypertensives).
A1AT Concentration Ratio in MI Patients in Relation to the Control Group Over the Time Points of the Study
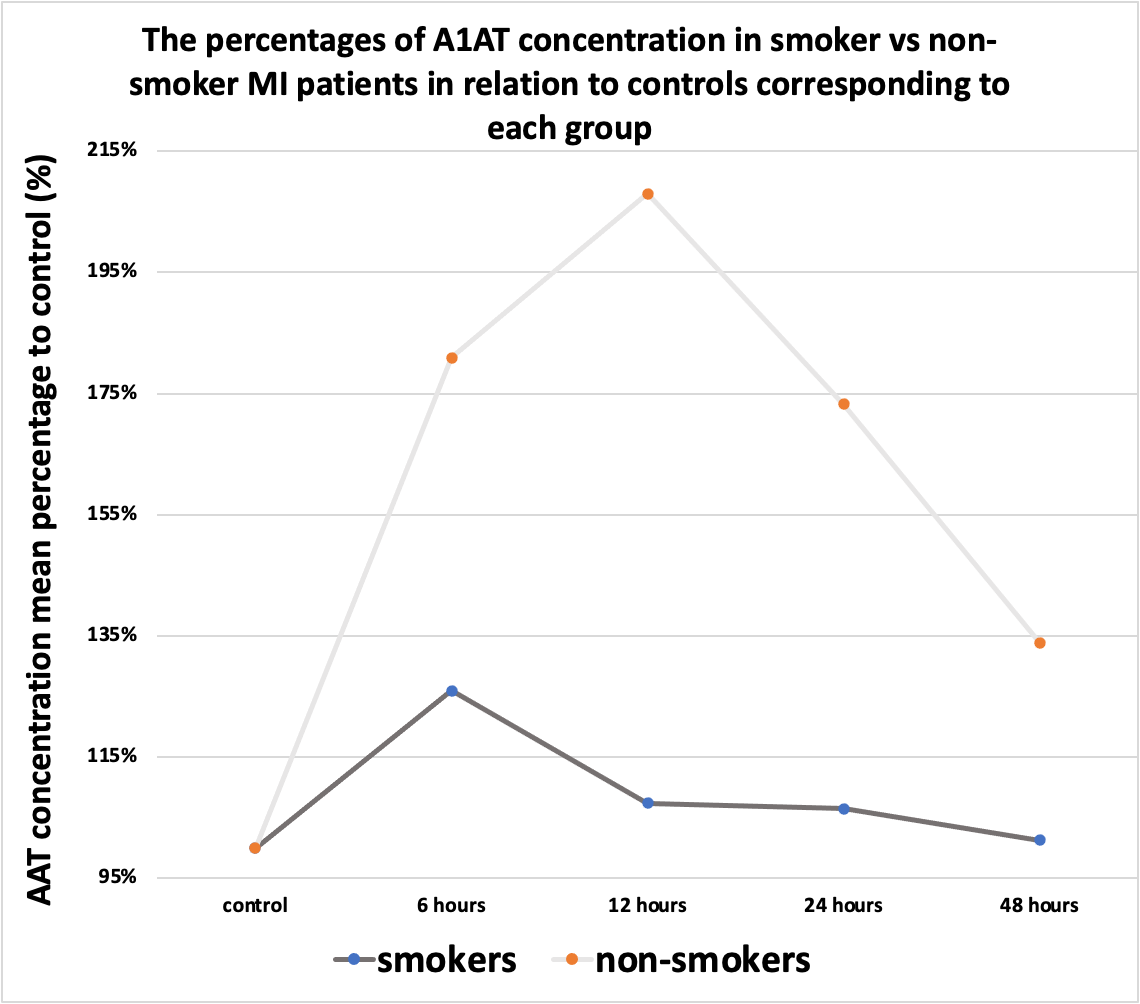
Figure 6. The percentages of A1AT concentration in the smoker and non-smoker MI patients in relation to controls corresponding to each group.
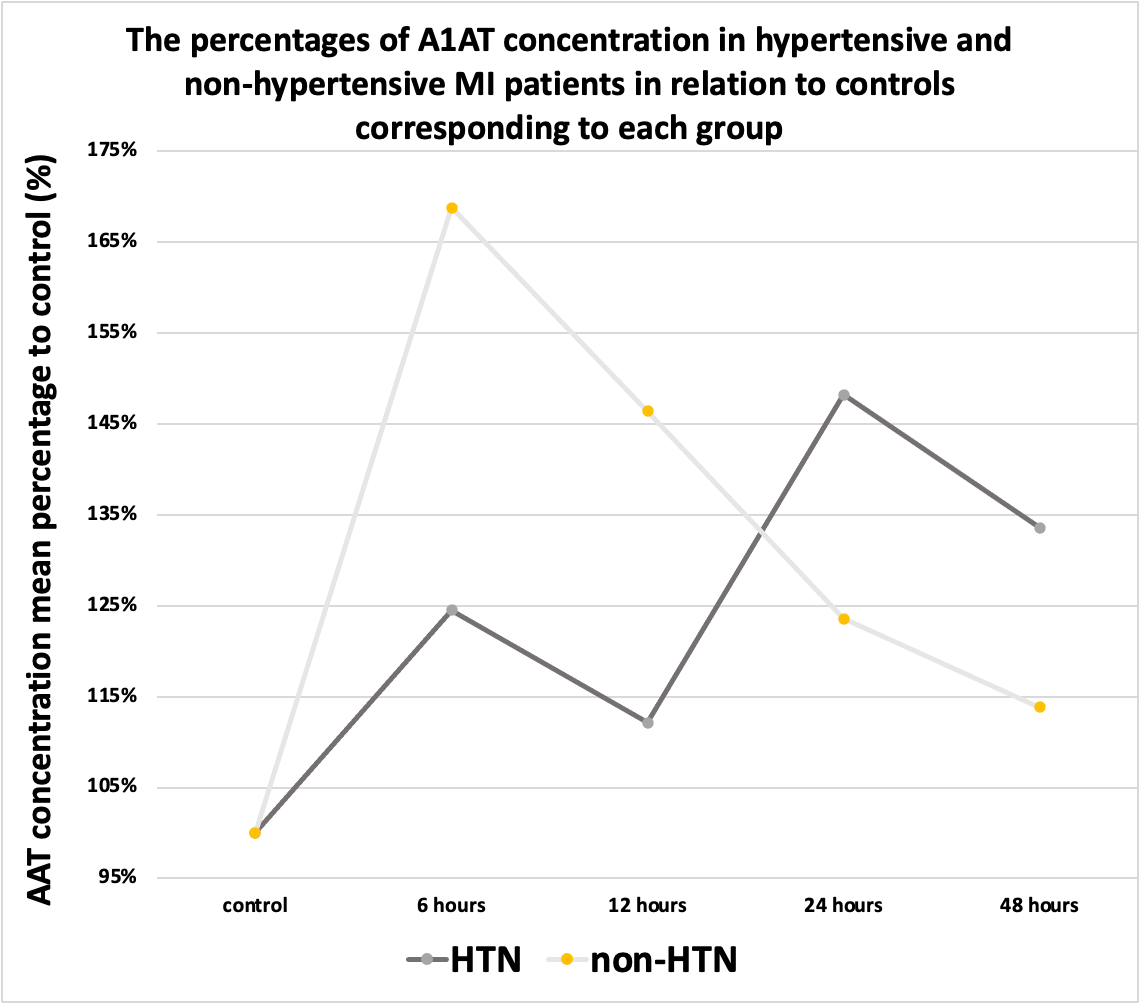
Figure 7. The percentages of A1AT concentration in the hypertensive and non- hypertensive MI patients in relation to controls corresponding to each group.
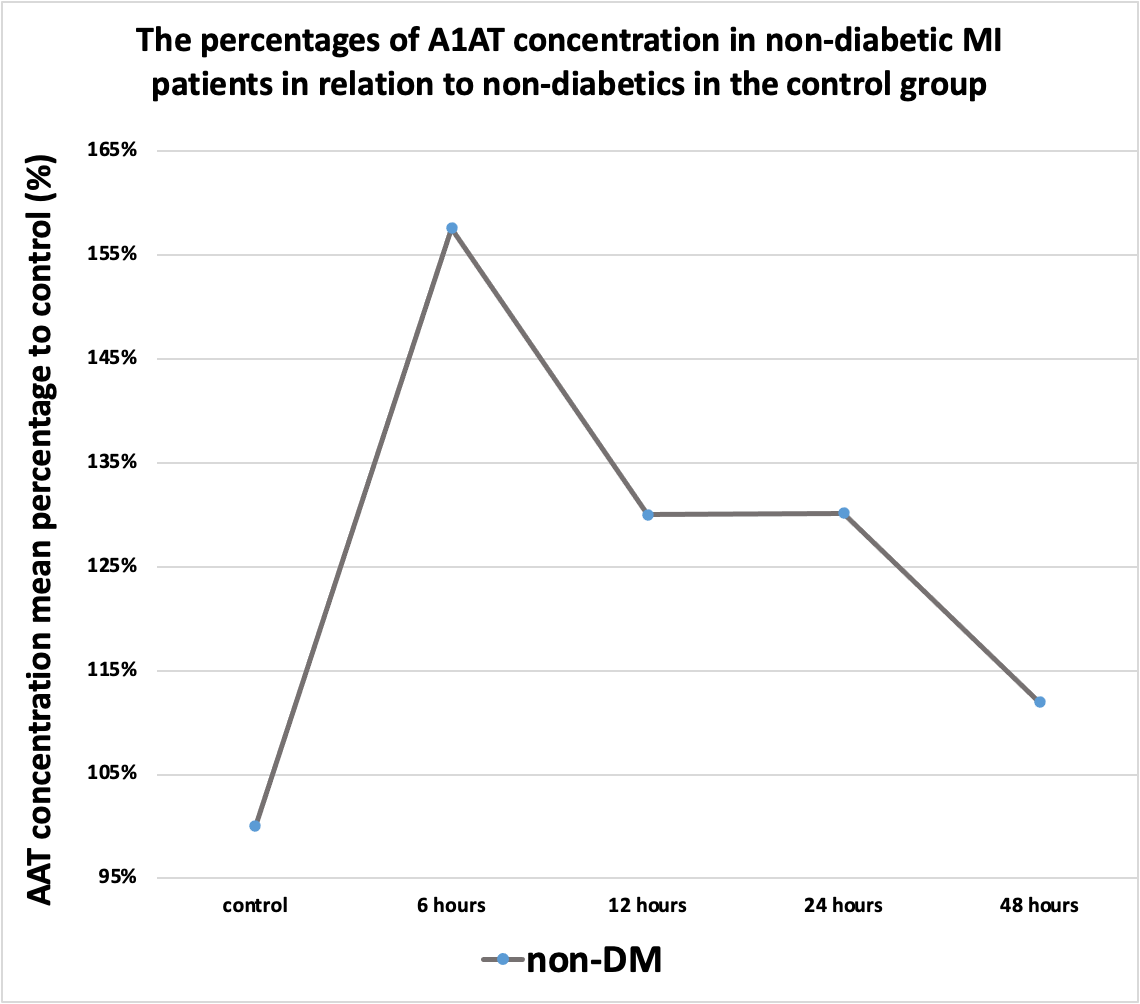
Figure 8. The percentages of A1AT concentration in non-diabetic MI patients in relation to non-diabetics in the control group.
During the first hours, the A1AT concentration ratio is elevated in all subgroups compared to the control group. However, after the first 6 hours, its ratio started to decline to different degrees as illustrated in Figures 6, 7, and 8.
DISCUSSION
A1AT in Acute MI
In myocardial infarction, the blood supply to certain areas stops. These areas are normally supplied via the blocked coronary artery. It is found that even after reperfusion, the area of myocardial infarction continues to enlarge for hours. We can rescue the injured but viable myocardium if we can stop signals leading to cell death. Shortly after ischemia-reperfusion, the caspase-1 inflammasome in the heart is activated, and this is a major contributor to the final infarct size. It is proven that plasma-derived A1AT plays an important role in the inhibition of inflammasome formation in vitro and in vivo as well [10]. Administration of plasma-derived alpha-1 antitrypsin (AAT) quenches the inflammatory response in experimental myocardial infarction in the mouse and reduces the amount of injury because of ischemia-reperfusion [11].
A1AT in our study
There was a significant difference in A1AT concentration at 6 hours between hypertensive (1.126 g/L ± 0.16 g/L) and non-hypertensive MI patients (1.74 g/L ± 0.12 g/L). This difference may be explained by assuming that hypertension is associated with decreased body ability to produce A1AT during inflammation. This could be a result of an alteration in the pathway responsible for producing A1AT, and this alteration may be caused by hypertension. This point is a subject of conflict in literature, whether hypertension is associated with increased or decreased levels of A1AT. All values are expressed as (g/L and mean ± SEM).
No significant difference was found in any of the other subgroups at any time point. Although it was shown that A1AT concentrations are higher in smokers compared to non-smokers with no statistically significant difference. This may be explained by the fact that smokers are under a chronic inflammatory status specifically in their lungs, so the mechanism that produces A1AT is already active in their bodies.
We also calculated the ratio between A1AT concentration in each of MI patients’ subgroups in comparison with its concentration in the corresponding subgroup in the control group.
In smokers, the ratio increased to a peak at 6 hours, then declined at 12 hours, plateaued at 24 hours then declined again at 48 hours. In non-smokers, the ratio seems to behave in the same manner as in smokers, however, the ratio is higher in non-smokers. This means that A1AT concentration in normal situations is higher in smokers compared with non-smokers, nevertheless, non-smokers are more capable of elevating their plasma A1AT during inflammatory processes such as acute MI.
In hypertensives, the ratio increased to a peak at 6 hours, then declined at 12 hours, then increased at 24 hours, and then declined at 48 hours. On the other hand, in non-hypertensives, the ratio peaked at 6 hours, then declined at 12 hours, then decreased more at 24 and 48 hours. The Ratio was higher in non-hypertensives compared to hypertensives, and this difference was statistically significant.
The knowledge about A1AT needs further evaluation considering specific factors and comorbidities. Further studies on larger samples are needed to find a relationship between A1AT levels during MI and survival. More studies on A1AT levels in hypertensives, smokers, and diabetics could add to our knowledge about the mechanism and causes of MI-related mortality in smokers.
Perspectives and Significance
In our research, we studied the level of A1AT in the first 48 hours after MI. Moreover, we looked for a link between A1AT levels in the blood after MI and the clinical outcome in terms of survival. We also examined the effect of some co-morbidities such as diabetes mellitus (DM), HTN, and smoking on A1AT concentration after MI.
If a link or a pattern of A1AT after an MI and the clinical outcomes can be established, this valuable biomarker could be made into a drug and given to MI patients to reduce the Ischemic Reperfusion Injury (IRI) sequelae on myocardial tissue while also improving the clinical outcomes.
CONCLUSION
The findings reveal that A1AT concentration increases during acute MI, as it is one of the acute phase reactants. Moreover, A1AT levels differ between patients with different comorbidities. Our findings suggest that A1AT response during acute MI is affected by the presence or absence of smoking or HTN.
SUPPLEMENTAL MATERIAL
Number of participants in subgroups of the control group and A1AT concentration in each subgroup.
REFERENCES
- Roth GA, Mensah GA, Johnson CO, Addolorato G, Ammirati E, Baddour LM, et al. (2020). Global Burden of Cardiovascular Diseases and Risk Factors, 1990-2019: Update From the GBD 2019 Study. J Am Coll Cardiol. 76(25):2982-3021.
- Cannon B. (2013). Cardiovascular disease: Biochemistry to behaviour. Nature. 493(7434):S2-S3.
- GBD 2017 Causes of Death Collaborators. (2018). Global, regional, and national age-sex-specific mortality for 282 causes of death in 195 countries and territories, 1980-2017: a systematic analysis for the Global Burden of Disease Study 2017. Lancet. 392(10159):1736-1788.
- GBD 2017 DALYs and HALE Collaborators. (2018). Global, regional, and national disability-adjusted life-years (DALYs) for 359 diseases and injuries and healthy life expectancy (HALE) for 195 countries and territories, 1990-2017: a systematic analysis for the Global Burden of Disease Study 2017. Lancet. 392(10159):1859-1922.
- Severino P, D'Amato A, Pucci M, Infusino F, Adamo F, Birtolo LI, et al. (2020). Ischemic Heart Disease Pathophysiology Paradigms Overview: From Plaque Activation to Microvascular Dysfunction. Int J Mol Sci. 21(21):8118.
- Barstow C, Rice M, McDivitt JD. (2017). Acute Coronary Syndrome: Diagnostic Evaluation. Am Fam Physician. 95(3):170-177.
- Kumar A, Cannon CP. (2009). Acute coronary syndromes: diagnosis and management, part I. Mayo Clin Proc. 84(10):917-938.
- Ong SB, Hernández-Reséndiz S, Crespo-Avilan GE, Mukhametshina RT, Kwek XY, Cabrera-Fuentes HA, et al. (2018). Inflammation following acute myocardial infarction: Multiple players, dynamic roles, and novel therapeutic opportunities. Pharmacol Ther. 186:73-87.
- de Serres F, Blanco I. (2014). Role of alpha-1 antitrypsin in human health and disease. J Intern Med. 276(4):311-335.
- Mauro AG, Mezzaroma E, Marchetti C, Narayan P, Del Buono MG, Capuano M, et al. (2017). A Preclinical Translational Study of the Cardioprotective Effects of Plasma-Derived Alpha-1 Anti-trypsin in Acute Myocardial Infarction. J Cardiovasc Pharmacol. 69(5):273-278.
- Toldo S, Seropian IM, Mezzaroma E, Van Tassell BW, Salloum FN, Lewis EC, et al. (2011). Alpha-1 antitrypsin inhibits caspase-1 and protects from acute myocardial ischemia-reperfusion injury. J Mol Cell Cardiol. 51(2):244-251.
- Abouzaki NA, Christopher S, Trankle C, Van Tassell BW, Carbone S, Mauro AG, et al. (2018). Inhibiting the Inflammatory Injury After Myocardial Ischemia Reperfusion With Plasma-Derived Alpha-1 Antitrypsin: A Post Hoc Analysis of the VCU-α1RT Study. J Cardiovasc Pharmacol. 71(6):375-379.
- Khatib SY, AlJinabi MM. (2022). Time course of blood level of alpha‐1 antitrypsin over 96 hours in smokers and hypertensive patients after acute myocardial infarction. The FASEB Journal. 36 p.
- Lubrano V, Vergaro G, Maltinti M, Ghionzoli N, Emdin M, Papa A. (2020). α-1 Antitrypsin as a potential biomarker in chronic heart failure. J Cardiovasc Med (Hagerstown). 21(3):209-215.
- Lind P, Engström G, Stavenow L, Janzon L, Lindgärde F, Hedblad B. (2004). Risk of myocardial infarction and stroke in smokers is related to plasma levels of inflammation-sensitive proteins. Arterioscler Thromb Vasc Biol. 24(3):577-582.
 Abstract
  PDF
PDF

